 Will Hoskin-Elliott

3
BYE
STK GWS

Ads provide web developers the support to continue providing their services. If our ads are of annoyance, please provide recommendations to help us improve.
Will Hoskin-Elliott
DT Average Against the Opposition
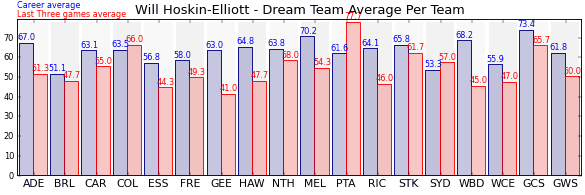
| Team | Games | Last 3 Avg. | Overall Avg. | Difference |
|---|---|---|---|---|
| Port Adelaide | 14 | 77.7 | 61.6 | 16.1 |
| Carlton | 16 | 74.0 | 63.3 | 10.7 |
| Collingwood | 4 | 66.0 | 63.5 | 2.5 |
| St. Kilda | 9 | 61.7 | 65.8 | -4.1 |
| North Melbourne | 13 | 58.0 | 63.8 | -5.8 |
| Sydney | 18 | 57.0 | 53.3 | 3.7 |
| Gold Coast | 12 | 57.0 | 70.4 | -13.4 |
| Melbourne | 17 | 54.3 | 70.2 | -15.9 |
| Adelaide | 13 | 51.3 | 67.0 | -15.7 |
| Western Sydney | 12 | 50.0 | 61.8 | -11.8 |
| West Coast | 13 | 47.0 | 55.9 | -8.9 |
| Richmond | 12 | 46.3 | 64.1 | -17.8 |
| Western Bulldogs | 11 | 45.0 | 68.2 | -23.2 |
| Brisbane | 16 | 44.3 | 49.9 | -5.6 |
| Essendon | 19 | 44.3 | 56.8 | -12.5 |
| Geelong | 15 | 41.0 | 63.0 | -22.0 |
| Fremantle | 11 | 34.3 | 54.2 | -19.9 |
| Hawthorn | 13 | 29.0 | 60.8 | -31.8 |
Ads provide web developers the support to continue providing their services. If our ads are of annoyance, please provide recommendations to help us improve.